Debugging Struts
The example code for this tutorial, debugging-struts, is available for checkout at struts-examples.
Introduction
During development of a Struts web application you may want to view the information being managed by the Struts framework. This tutorial will cover two tools you can use to see how Struts views your web application. One tool is the Struts configuration plugin and the other is the debugging interceptor. This article also discusses how to set the log level to see more or fewer log messages.
The Struts user mailing list is an excellent place to get help. If you are having a problem getting the tutorial example applications to work search the Struts mailing list. If you don’t find an answer to your problem, post a question on the mailing list.
Configuration Plugin
The Struts config browser plugin provides details about the configuration the Struts framework is using to run your application. To use the plugin your application needs to have the struts2-config-browser-plugin-x.x.x.x.jar in your application’s class path. The config-browser-plugin jar is part of the Struts download and is also available in the Maven repository.
To use the plugin in your application, just call index.action in namespace config-browser. For example you could have
the following link on your admin page (or just anywhere during your development).
<a href='<s:url action="index" namespace="config-browser" />'>Launch the configuration browser</a>
In the example application, there is a link to the configuration browser on the index.jsp page.
Clicking on the link for the configuration browser will cause the Struts framework to return this page to your browser.
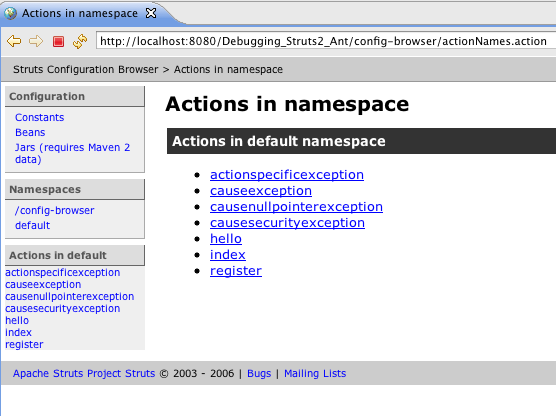
You can click on an action link to see the configuration for that action. For example clicking on the register action link results in this.
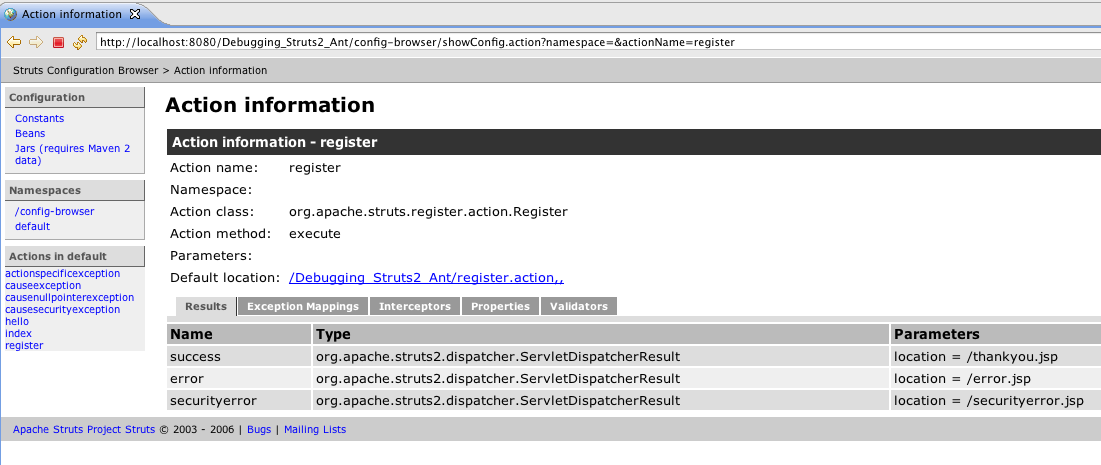
You may then click on one of the tabs (Results, Exception Mappings, Interceptors, Properties, Validators) to get more information about how the Struts framework has configured that specific action.
On the left side of the page is the config browser plugin menu. Clicking on constants will render a view that lists all the Struts constants and their properties for your application. Clicking on beans shows the beans Struts is managing. Clicking on Jars shows the jars your application is using.
Using the Debugging Interceptor
If you have set devMode to true (in the example application see struts.xml) then one of the interceptors that is
activated when Struts processes an action is the DebuggingInterceptor. The DebuggingInterceptor looks for a query
string appended to the action URL with a name of debug and a value of xml, console, command, or browser.
If the DebuggingInterceptor finds that query string then it will halt further execution of the action and instead return
to the browser debugging information. The format of the returned information depends on the value of the debug query parameter.
See DebuggingInterceptor for more detail.
In the example application on the index.jsp is a link for displaying debugging information. This link includes the query
string debug=browser. If you click on this link you’ll see a table with columns that can be expanded and collapsed.
The table contains the various objects and their state being managed by the Struts framework.

Note that to enable the correct display and interaction of the expand/collapse links on the debugging information web page
you need to include the s:head tag in your JSP’s head section (see index.jsp in the example application) and also include
the Struts dojo plugin in your application’s class path. The Struts dojo plugin is available as part of the Struts
download and from the Maven repository.
Struts Logging
The Struts framework will write to a log a great deal of information if you’ve configured the log properties to log at
the debug level. In the example application, view log4j2.xml. The two major packages involved in the Struts framework,
com.opensymphony and org.apache.struts2, are configured to write debug and above log messages. When you run the application
view the standard out for your Servlet container to see all the information written to the log. Please check Logging
page for other options.
Summary
Using the configuration browser plugin and the debugging interceptor can assist you in trouble shooting a problem with a Struts web application. These tools should only be used in development.
Prior to creating your war file for deployment to production you should change devMode to false and remove the debugging
links. You may also want to adjust the level of logging in your log properties file to a higher level (info or warn) to reduce
the number of log messages.
| Return to Exception handling | or | onward to Form tags |